
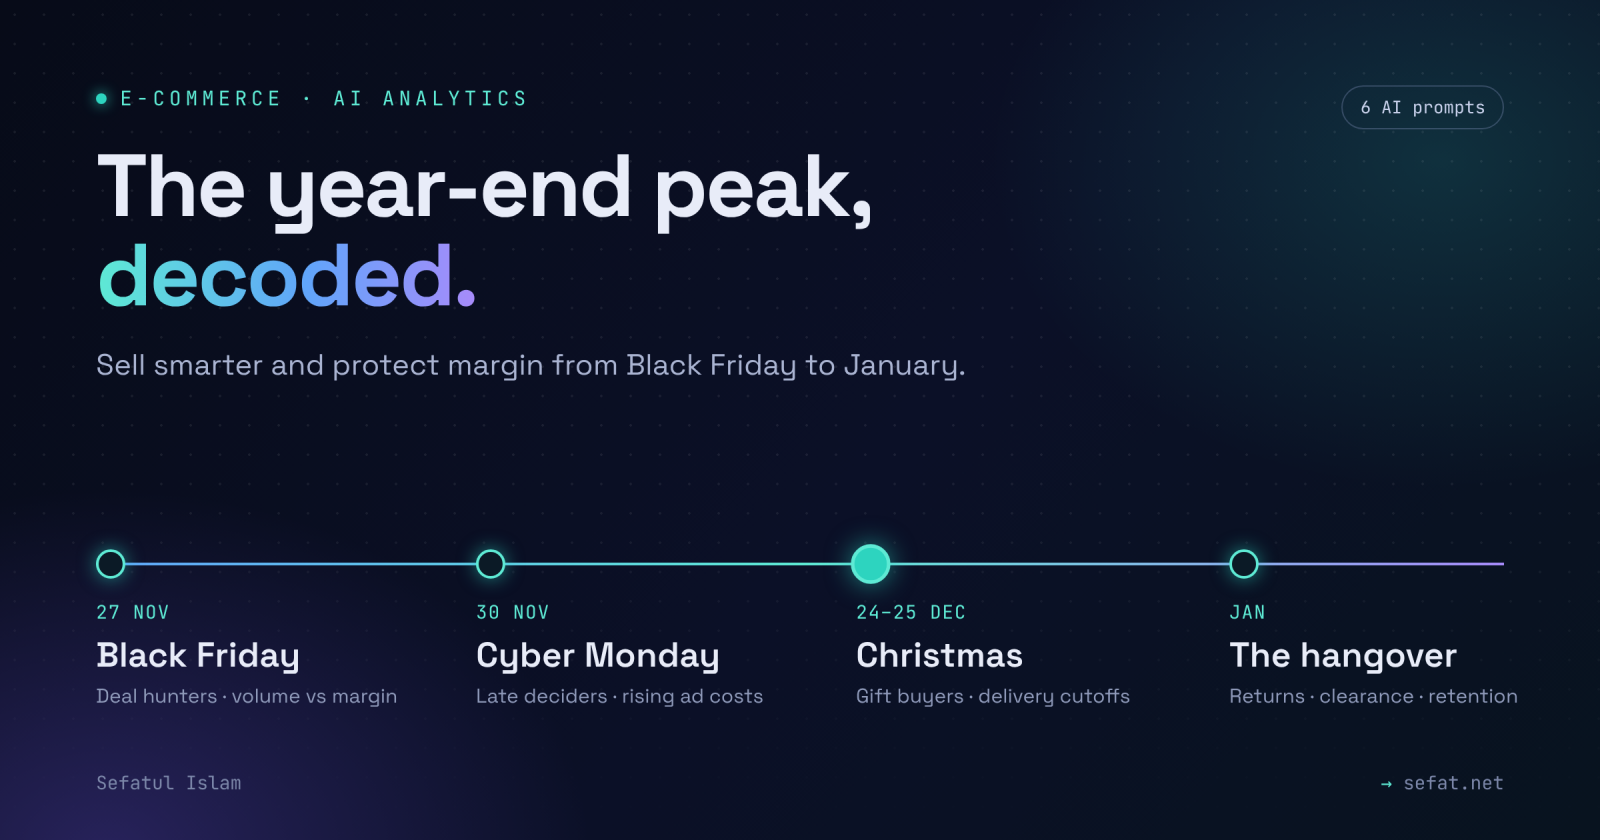
The year-end peak isn’t one event. It’s a run of selling moments, each with its own kind of shopper and its own risks to your margin. Three of them matter most.
The three moments that define the peak
Black Friday (27 November 2026) The Friday after American Thanksgiving, and the official start of the holiday shopping season. In many markets, including the Nordics, it has grown into a full Black Week (roughly 23–30 November). Shoppers are deal hunters: they compare prices, have wish lists ready and respond to the deepest discounts. It’s usually the biggest day for order volume, and the biggest risk of selling a lot without making much money. Watch: contribution margin per campaign, how fast your bestsellers sell out, and how much discount you’re giving away.
Cyber Monday (30 November 2026) The Monday after Black Friday, created to focus on online sales. It’s the last big push of the deal weekend and often catches shoppers who waited, compared prices or were still comparing on Black Friday. Expect a high share of mobile traffic, price-sensitive late deciders and heavy competition for the same ad space. Watch: stock left after the weekend, rising ad costs, and whether the deals you extended are still worth running.
Christmas (24–25 December, with the run-up through December) The longest and most valuable part of the peak. The shopper changes from a deal hunter to a gift buyer. Being sure the parcel arrives on time matters more than the price. In Sweden and much of Northern Europe, the gifts are opened on Christmas Eve (24 December), so the delivery deadline comes even earlier. After Christmas comes a second wave: returns, gift card redemption and boxing-day and January sales. Watch: last delivery dates, gift-friendly product data, return rates and January follow-up.
Peak season in three phases
For planning, these moments fall into three phases, and each one raises different questions:
First, the deal rush and gift rush. From Black Week and Cyber Monday until the last delivery date before Christmas, customers hunt for deals, then buy for other people and expect delivery on time. Then, the cutoff. Once the last delivery date passes, the store you planned for stops being the store your customers can use. Finally, the hangover. Between Christmas and the first week of January, returns come in, gift cards get spent, and stock has to be cleared before the books close.
Most teams plan carefully for Black Friday and improvise through the rest. That’s where margin quietly disappears.
AI can help you keep up. It won’t replace your judgment. It answers in minutes the cross-system questions that would otherwise take a week of spreadsheet work. Below are six analyses built for the year-end period. Each comes with a prompt you can use today, whether you work from CSV exports or a connected data stack.
Before you prompt: give the AI a map of your data
A language model sees columns. It doesn’t know what they mean. It won’t know that net_sales in your shop export already excludes VAT and revenue in your ad platform doesn’t. It also won’t know that an order ID in one file is a transaction ID in another. Give it files without context and it will guess. And it guesses confidently.
So before any analysis, start the conversation with a short data brief. It takes ten minutes to write and you can reuse it all season:
Context prompt (paste this first): “You are helping me analyse e-commerce data for the year-end season. Here is what each file contains: [file name, one line per file]. These columns link the files: [e.g.
order_id=transaction_id,sku=product_code]. Our definitions: revenue is [incl./excl. VAT, before/after returns]; contribution margin = [your formula]. Before calculating anything, restate these definitions in your own words, list any columns you can’t interpret, and flag files that don’t share a usable key.”
Three habits make every answer more trustworthy:
- Ask for an assumptions table. Every result should list what the AI assumed.
- Spot-check one number by hand. If one SKU’s margin is wrong, all of them probably are.
- Separate “the data says” from “I recommend”. Ask the AI to label each one.
1. What is your profit after returns?
Holiday orders look great on the day they’re placed. Some of that revenue comes back in January, with return shipping, handling and unsellable stock on top. Black Friday impulse buys, gift purchases and “buy two sizes, keep one” behaviour push return rates up, and the effect differs a lot by category.
Analyse: return rate by category and product, return-adjusted contribution margin, and how last year’s year-end returns compared with the rest of the year.
Prompt:
“Using last year’s orders and returns data, calculate the return rate for orders placed in three windows (Black Week and Cyber Monday, 1–24 December, and 25–31 December), by product category. Compare it with the same categories during the rest of the year. Then estimate this season’s return-adjusted contribution margin per category, including return shipping and handling at [cost per return]. Show your formula, and list categories where return data is too thin to trust.”
How to act: Stop pushing products whose margin disappears after returns. Strengthen size guides, product images and descriptions where returns are driven by “not as expected” reasons.
Daily check: Which top-selling category looks profitable today but probably won’t be by mid-January?
2. What can still arrive in time?
Every December there’s a day when “Order now, delivered before Christmas” stops being true for parts of your range. That day differs by carrier, warehouse, region and product. Marketing calendars rarely reflect this. Campaigns keep promoting products that can no longer arrive in time, and customers who notice simply leave.
Analyse: delivery promise per product and region against the carrier cutoffs, stock location (central warehouse, store or drop-ship), and which products remain giftable after the cutoff (click & collect, digital, gift cards).
Prompt:
“Here are our carrier cutoff dates by region and our products with stock location and typical lead time. For each product, find the last order date that still guarantees delivery before 24 December. Group products into: safe to promote, promote with a delivery warning, and stop promoting. For the period after the cutoff, suggest which products and formats (click & collect, e-gift cards, digital) should replace them in campaigns and on the homepage.”
How to act: Build a “still arrives in time” collection and swap it into ads, email and onsite banners as each cutoff passes. After the final cutoff, switch the message to gift cards and in-store pickup.
Daily check: Is every product in today’s ads still deliverable on the date the customer cares about?
3. What are gift buyers searching for that you can’t show them?
Gift buyers search differently from regular shoppers. They type things like “gift for dad who likes cooking”, “under 500” or “for 10 year old”. Your catalog is organised by brand, category and SKU. When the two don’t match, onsite search returns nothing or the wrong things, and the visitor leaves without buying.
Analyse: onsite search terms with zero or low results, searches followed by an exit, and price, recipient or occasion phrases your product data doesn’t capture.
Prompt:
“Here is our onsite search log for the last 30 days with result counts and post-search behaviour. Identify searches with zero results, low results, or a high exit rate. Group them into themes (recipient, price range, occasion, attribute, misspelling, out-of-range product). For each theme, tell me whether it’s a missing product, a missing product attribute, or a search configuration problem, and estimate which themes affect the most sessions.”
How to act: Add synonyms and redirects for high-volume failed searches. Create gift collections by recipient and price band. Most importantly, fill in the missing attributes in your product data, because that one fix improves search, filters and advertising feeds together.
Daily check: Which three failed searches did the most visitors type yesterday, and has anyone fixed them?
4. Can AI shopping assistants recommend your products?
More people now start their gift research by asking an AI assistant: “Find me a waterproof jacket for a teenager, delivered before Friday, under 1,200.” To recommend your product, the assistant has to read structured facts such as material, size range, price, stock status, delivery time and return policy. A beautiful product page doesn’t help if those facts are buried in images or vague marketing copy.
This is the part of peak readiness most retailers haven’t looked at yet.
Analyse: completeness of your product feed and structured data (schema.org markup, Merchant Center feed or any agent-facing catalog), critical attributes missing on your bestsellers, and whether price, availability and delivery information is kept up to date in real time.
Prompt:
“Here is our product feed export and our top 200 products by revenue. For each product, check whether these attributes are present and specific: title, brand, GTIN, price, availability, size/variant data, material, colour, age or recipient suitability, delivery time, and return policy. Score each product from 0 to 100 for ‘machine readability’. List the 20 highest-revenue products with the lowest scores and the exact fields to fix first.”
How to act: Fix the bestsellers first, not the whole catalog. Make sure stock and price changes reach your feeds quickly during peak. An assistant that recommends an out-of-stock item learns not to trust your data.
Daily check: If a customer asked an AI assistant for your best-selling gift, does it have enough data to say yes?
5. What do you need to clear before the year closes, and what shouldn’t you discount at all?
Excess stock on 31 December affects inventory valuation, ties up cash and takes warehouse space you’ll need for spring. The usual response, a sitewide sale, has a cost of its own. It discounts products that would have sold at full price anyway.
Analyse: stock cover in weeks per SKU, sell-through since 1 November, inventory value at risk, items that move at full price, and items with ageing stock that can only move with a markdown.
Prompt:
“Using current stock, cost price, and daily sales since 1 November, calculate weeks of cover and projected stock value on 31 December for every SKU. Classify products as: sells without discount, needs a light markdown, needs a deep markdown or bundle, or hold for next season. For each group, estimate the margin impact of the proposed action versus doing nothing. List your assumptions about demand after Christmas.”
How to act: Discount selectively, not sitewide. Bundle slow movers with popular products. Keep full-price bestsellers out of the sale and protect their margin for the people who’ll buy them anyway.
Daily check: Which items are on sale today that didn’t need to be?
6. Who will come back in January?
The year-end peak brings in two kinds of new people: the buyers who paid and the recipients who received the products, returned them or redeemed the gift cards. Most retailers only follow up with the buyers, and often with another discount.
Analyse: first-time year-end customers versus returning ones, repeat-purchase rate from last year’s December cohort, gift card issuance versus redemption, and which entry products lead to a second purchase.
Prompt:
“Look at customers whose first order was placed between 1 November and 24 December last year. What share bought again within 90 days, and what did they buy? Compare them with first-time customers from other months. Identify which first-purchase categories and order values are linked to higher repeat rates. Then look at this year’s gift card sales and estimate how much redemption value to expect in January. Note that past repeat rates are indications, not predictions.”
How to act: Plan January email flows by first-purchase category, not as one generic “thanks, here’s 10%”. Prepare landing pages for gift card redeemers, who are often new to your brand. Reward the customer segments that come back without needing a discount.
Daily check: Do you know which of this December’s new customers are worth winning back, and how?
Your year-end rhythm
Use these at the morning stand-up. The questions change as the season moves along.
Black Week and Cyber Monday
- Margin: Which deals drive profit and not just volume?
- Stock: Which bestsellers will sell out before the Christmas rush?
Gift rush (December → last delivery date)
- Profit: Which categories still make money once expected returns are counted?
- Delivery: Is everything we promote still deliverable in time?
- Search: Which gift searches are failing, and what do we fix today?
Cutoff week
- Messaging: Have campaigns switched to click & collect, gift cards and digital?
- Data: Are price, stock and delivery dates current in every feed, including the ones AI assistants read?
The hangover (25 December → early January)
- Stock: What has to clear before 31 December, and what should stay at full price?
- Customers: Which new buyers and gift recipients get a tailored follow-up?
- Returns: Which return reasons point to a product-data or product-page fix?
Prompts are the easy part
Every prompt above assumes something that rarely holds: that your order, return, cost, ad, inventory and product data line up. In most e-commerce businesses they live in separate systems, update at different times and use different keys. Ask an AI to calculate return-adjusted margin on top of that, and you’ll get a confident number that’s quietly wrong.
The retailers who get real value from AI during peak have done three things beforehand:
- Agreed on definitions. Revenue, margin and return rate mean the same thing in every report and every prompt.
- Connected the systems. Orders, returns, costs, campaigns and stock link through shared keys, so an AI can follow a product from ad click to return label.
- Treated product data as a product. Attributes are complete, structured and kept up to date, so search, feeds and AI shopping assistants all read the same facts.
That’s the work I focus on: headless commerce architecture and product-data engineering that make a catalog easy for people, analytics tools and AI agents to read, trust and buy from. If you’d like to go into next year’s peak with data you can actually ask questions of, let’s talk.
Frequently asked questions
1. What is your profit after returns?
Holiday orders look great on the day they're placed. Some of that revenue comes back in January, with return shipping, handling and unsellable stock on top.
2. What can still arrive in time?
Every December there's a day when "Order now, delivered before Christmas" stops being true for parts of your range. That day differs by carrier, warehouse, region and product.
3. What are gift buyers searching for that you can't show them?
Gift buyers search differently from regular shoppers. They type things like "gift for dad who likes cooking", "under 500" or "for 10 year old".
4. Can AI shopping assistants recommend your products?
More people now start their gift research by asking an AI assistant: "Find me a waterproof jacket for a teenager, delivered before Friday, under 1,200." To recommend your product, the assistant has to read structured facts such as material, size range, price, stock status, delivery time and return policy.
5. What do you need to clear before the year closes, and what shouldn't you discount at all?
Excess stock on 31 December affects inventory valuation, ties up cash and takes warehouse space you'll need for spring. The usual response, a sitewide sale, has a cost of its own.